
The visual chart editing tool
Match your data to your vision
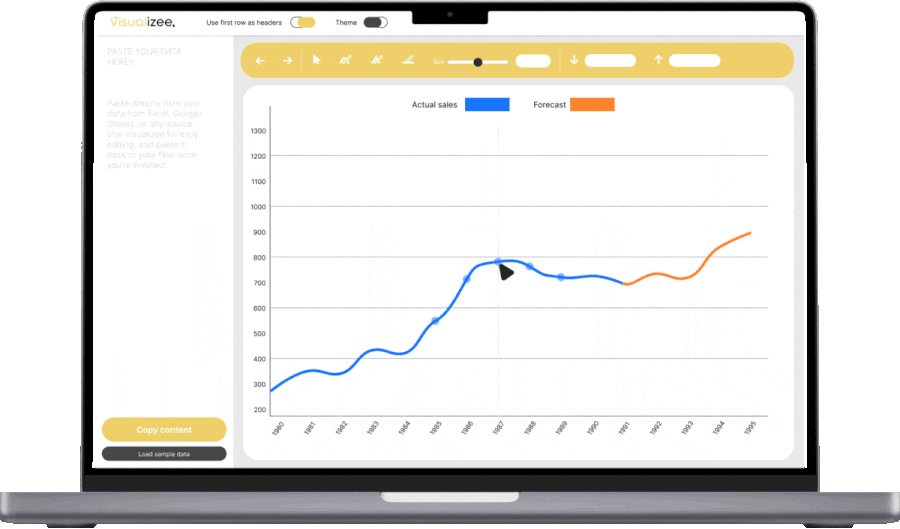
Revolutionize your charting experience and transform your ideas,forecasts or goals through a simple drag-and-drop interface. Fast-track your vision to reality in a snap!
Tailor-made features

Easy Connect
Experience the convenience of copying and pasting your data directly into the tool
Brush Tools
Transform entire sections of your chart. Whether you need a flat touch, a gentle curve, or a sharp point, we got you covered
Point Editing
Fine-tune individual data points with ease, ensuring your chart reflects the precise information you need
Data Safety
No need to worry about data leaks, your information is locally managed and doesen't leave your browser at any time
Our happy users


As a data scientist, I often deal with complex
datasets. Visualizzee has been a lifesaver, allowing me
to visually adjust charts without the need to tweak
the underlying data. It's a time-saving miracle!!
O. Clavijo
Data Scientist, MercadoLibre

I can easily modify charts to align with my financial
models, ensuring accurate representation. The
drag-and-drop functionality is intuitive, making it an
indispensable tool in my daily workflow.
M. Gray
PM, KX
Thanks to Visualizzee I can make quick adjustments and
clean outliers without getting stucked by complex data
structures.
M. Garcia
Researcher, UOE